|
|
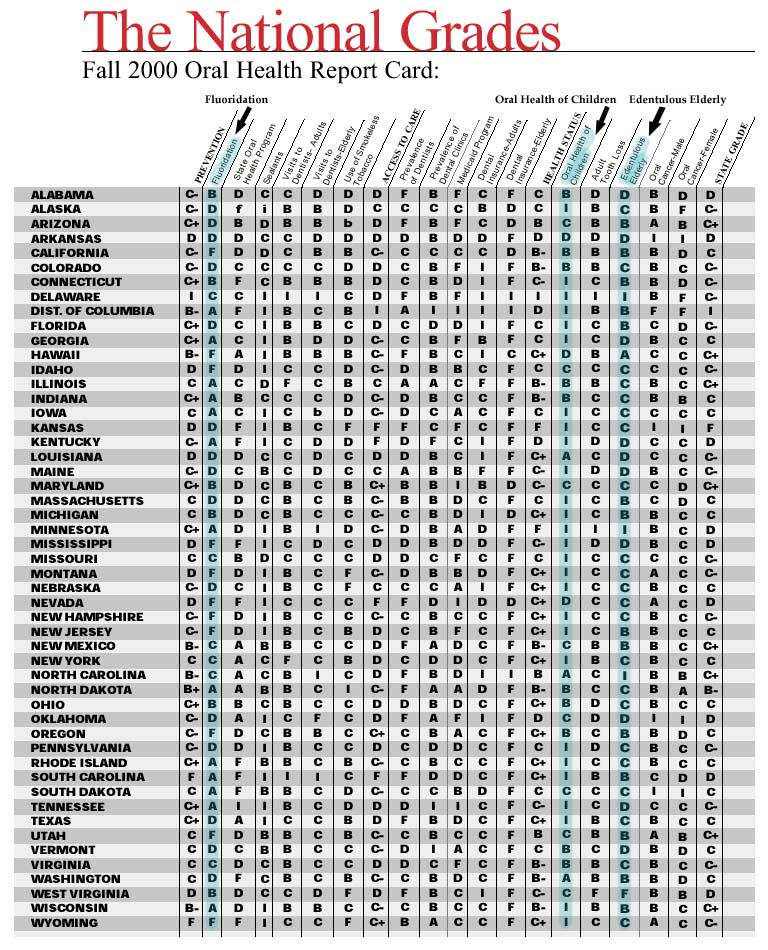
The following three columns are highlighted:
FLUORIDATION: "percentage of U.S. public water supply population using fluoridated water."
ORAL HEALTH OF CHILDREN: "measures the percentage of children with one or more cavities."
EDENTULOUS ELDERLY: "measures the percentage of people 65 and older without any natural teeth."
I = Incomplete
Titled "Missing the Mark: Oral Health in America," this first national grading project in 2000 revealed no correlation between increased water fluoridation and reduced cavities. Although endorsed by Surgeon General David Satcher, it was taken out of circulation, and subsequent report cards no longer even measured kids' cavity rates – which is strange when the centerpiece of the fluoridation sales pitch is less cavities. It was funded in part by the W.K. Kellogg Foundation* who also helped fund the subsequent two report cards (which are available from Oral Health America).
Oral Health America's true colors are revealed by their other organization, the National Center for Fluoridation (NCF) which claims to be filling the void with "reliable, timely, & scientifically-based information about community water fluoridation." Strange again, the website fails to mention the best, most recent science, the National Research Council's landmark 2006 report: "Fluoride in Drinking Water: A Scientific Review of Environmental Protection Agency's Standards." (See Reference #32.) Instead, visitors get a load of sales pitches citing other fluoride pushers, which is no surprise because NCF's Director is the infamous Michael Easley, DDS, MPH.
Oral Health America's other major funder was the Robert Wood Johnson Foundation, the source of the 25-year-old myth that water fluoridation costs "less than $1 per child per year." (See Reference #22.) Charts of CDC data show statistical associations between states' fluoridation rates
Water Fluoridation – Sales Pitch vs. Reality Check
|