|
Needs to Be Known
Know News
|
A decades-old problem: Fluoridated Water's Association with
|
|
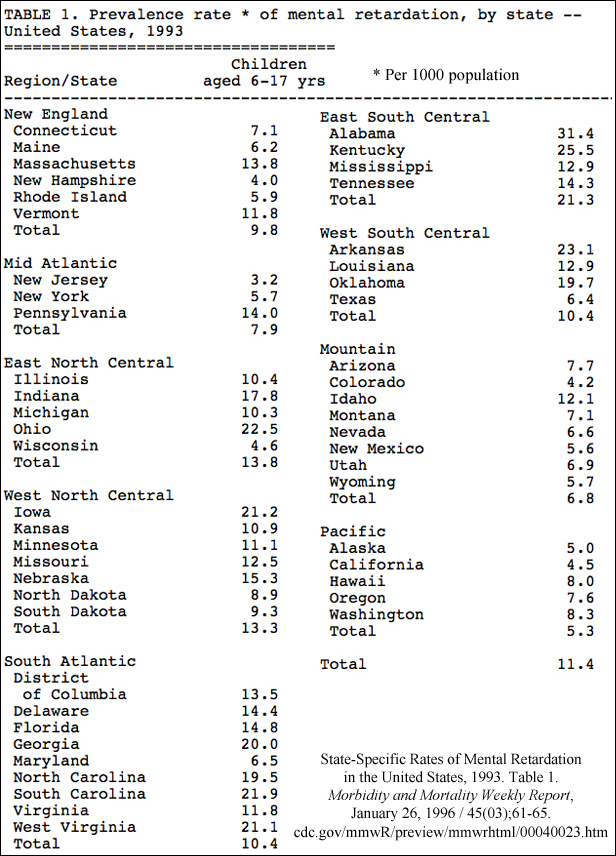
In 1993, prevalence rates of children (ages 6-17) with mental retardation
• In the 26 states fluoridated above the national average (62.1%), mental retardation prevalence averaged 13.46 children per 1,000 population.
Fluoridated drinking water was therefore associated with about 3,370 more mentally retarded children per one-million population in 1993. |
"Average lifetime costs per person were estimated at $1,014,000
for persons with mental retardation." – CDC (2003)


Fluoridation Rates (1992) View images to enlarge Mental Retardation Rates (1993)
The federal government stopped using the term mental retardation
in 2010 and replaced it with "intellectual disability."
|
In 2012, prevalence rates of students (ages 6-21) with intellectual
In the 10 most fluoridated states:
Fluoridation Rates (2012)
|
|
Autism and Fluoride Sensitivity:
|
"Over the past half century the prevalence of childhood disability increased dramatically... The percentage of children with disabilities rose 16% between 2001 and 2011... Disability due to neurodevelopmental or mental health conditions rose substantially." – Pediatrics (2014)
What has also increased dramatically over the past half century is the number of Americans consuming fluoride, the EPA-designated "developmental neurotoxicant" added to their drinking water and to beverages tht are produced in fluoridated cities.
|
Institute of Medicine (2007)
"Many studies have documented the prevalence of a broad range of neurodevelopmental impairments in preterm survivors. The spectrum of neurodevelopmental disabilities includes cerebral palsy, mental retardation, visual and hearing impairments, and more subtle disorders of central nervous system function." See Premature Birth page. |